Economics Final Presentation
How countries build their own smart computer networks, and the economic rules behind it.

1. Demand & Customer Choices
Basic, generic AI models are highly sensitive to price changes (elastic). If one provider raises their price, companies quickly switch to a cheaper substitute. However, specialized, custom integrations are much harder to replace (inelastic), giving Fusemachines more pricing freedom. (Source: Varian, 2014)
Corporate buyers increasingly want localized data privacy. This shift in preferences moves our demand curve to the right, making local AI solutions much more valuable than generic foreign alternatives.
2. Costs, Revenue & Profits
Traditional consulting firms have high variable costs because they must hire more people to do more work. Fusemachines breaks this rule. We pay a flat, one-time setup cost (Fixed Cost) to build our core AI Engines. Once built, the cost of copying that engine for a new customer (Marginal Cost) is almost zero. (Source: Shapiro & Varian, 1998)
This drives down the Average Cost per customer as we scale, dramatically increasing corporate profit margins.
3. Market Structure & Competition
How we use entry barriers, unique features, and network loops to protect our business.
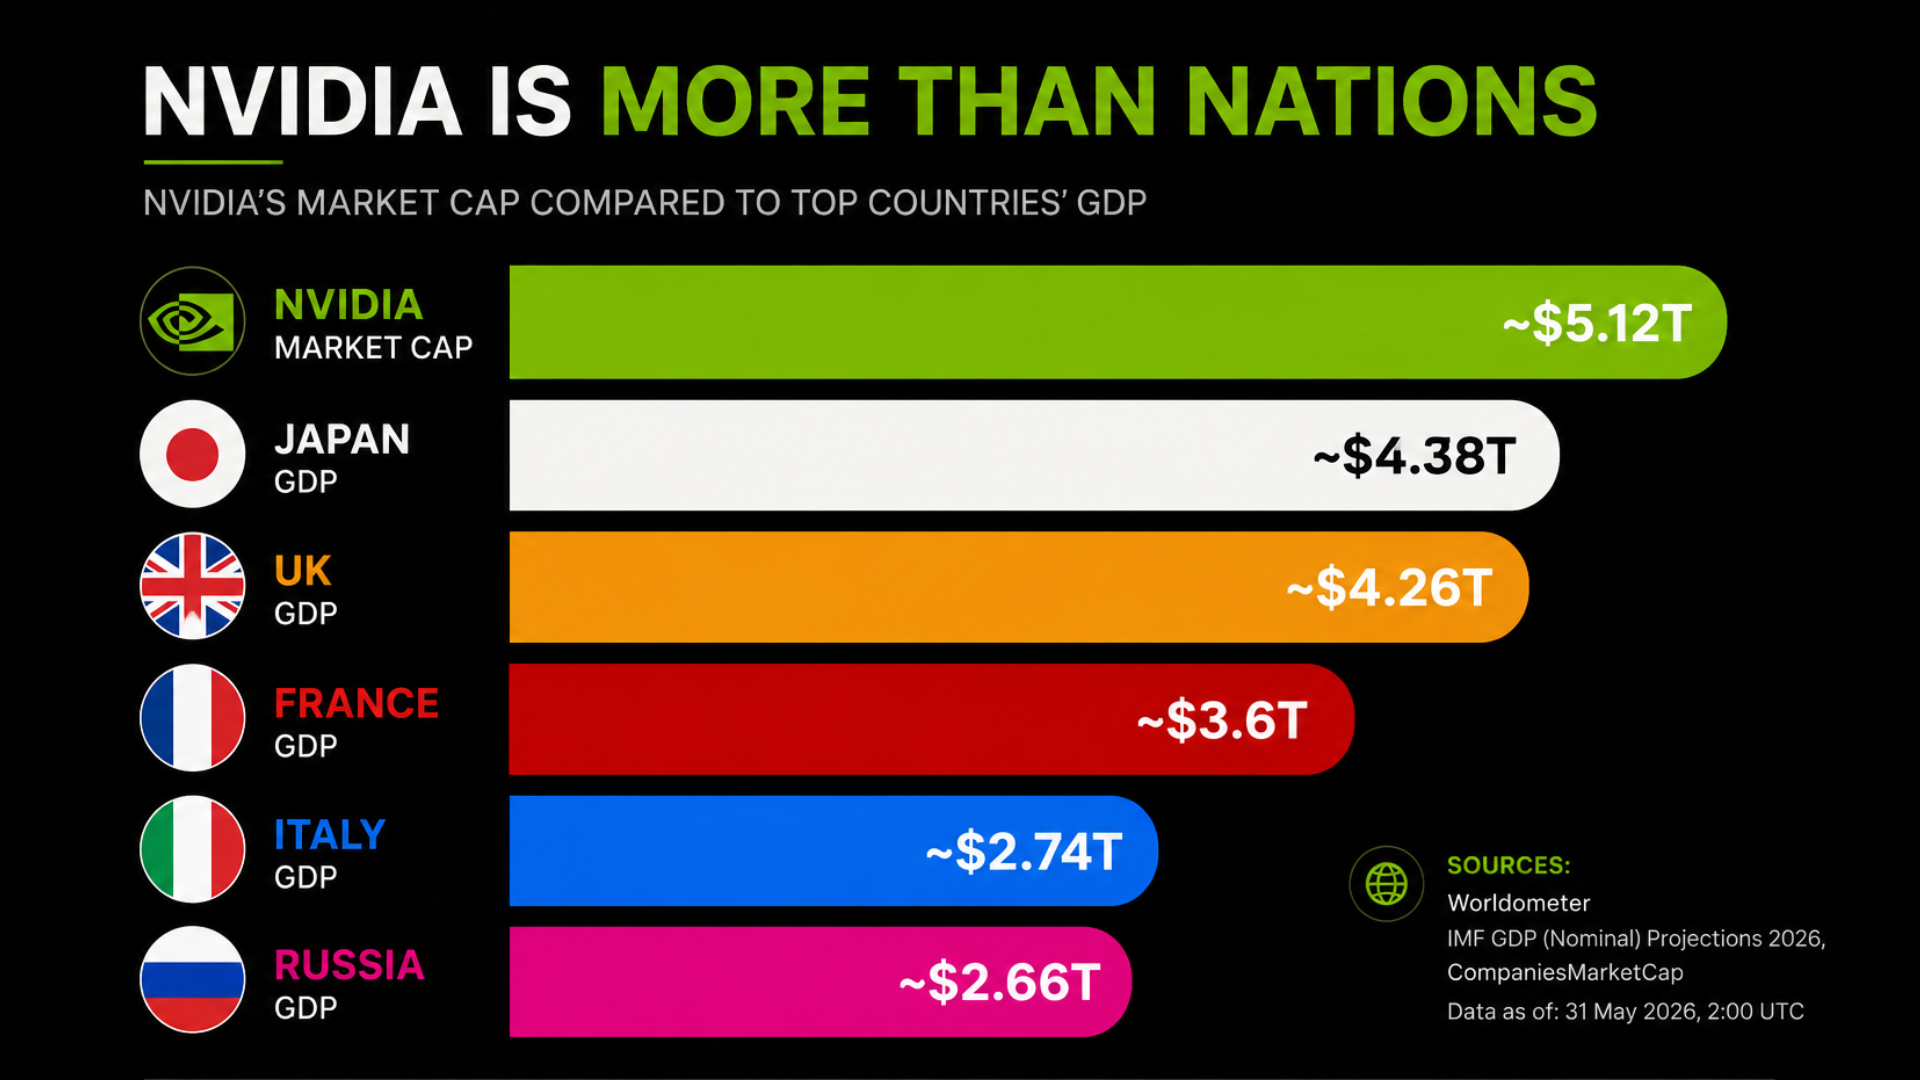
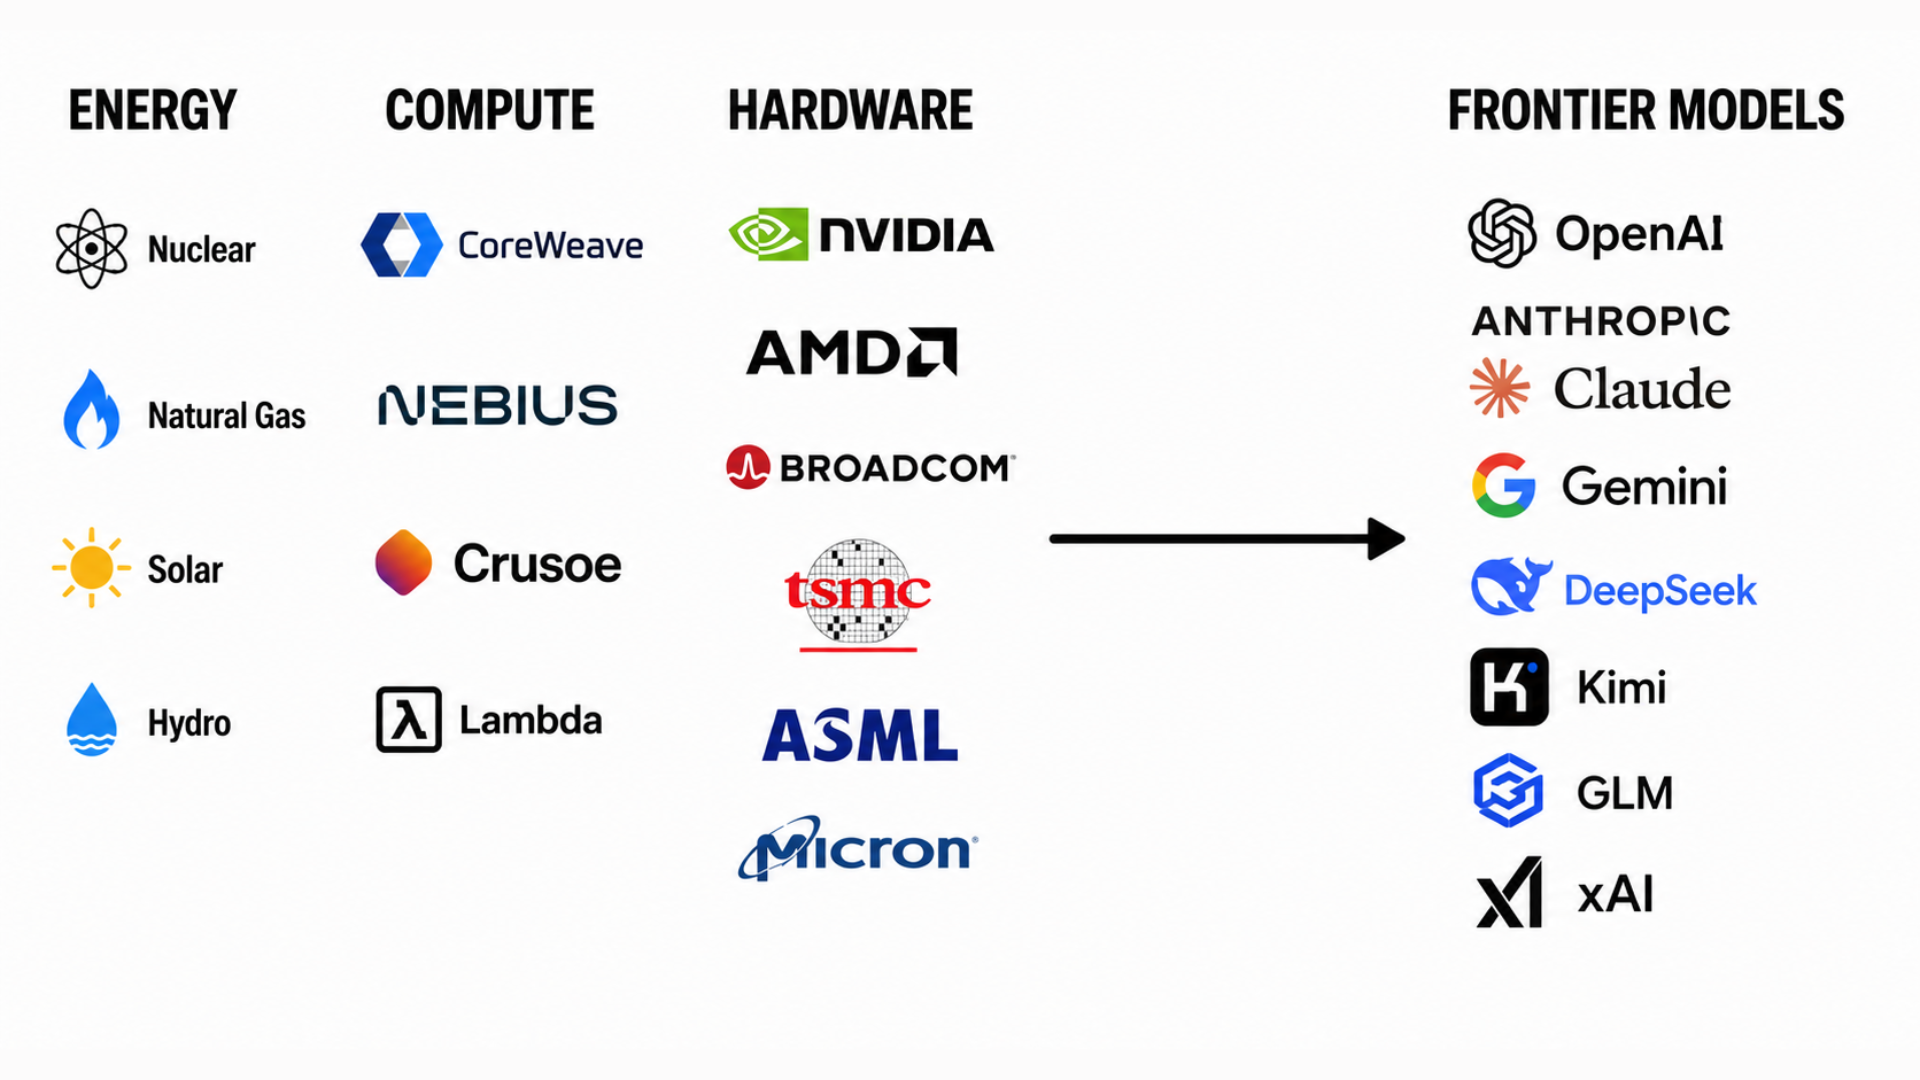
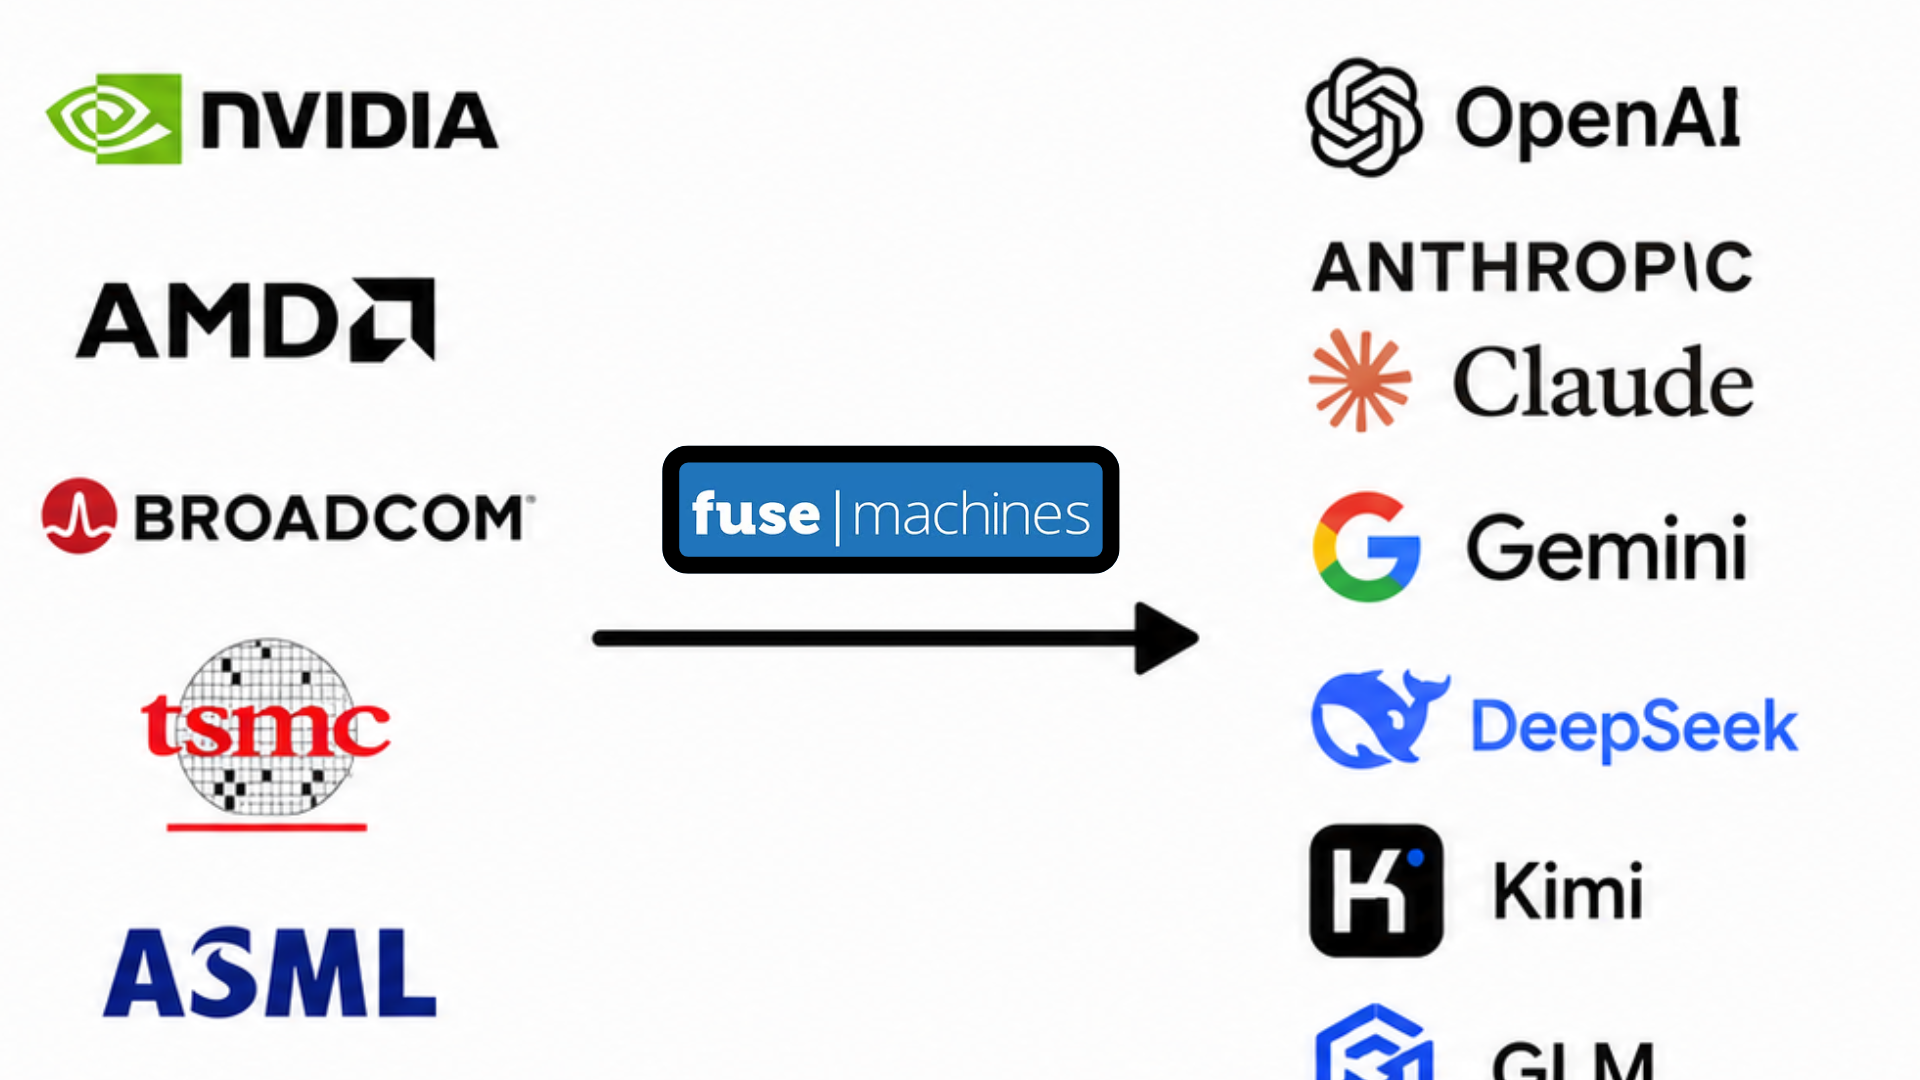
Building physical computer chips and data centers costs billions of dollars. Giant tech firms own these blockades. FUSE avoids this layer completely and operates on software instead. (Source: Porter, 2008)
FUSE sells specialized vertical apps (like AI helpers for real estate or recruitment). Because our software is highly customized, we do not have to fight in a perfect competition market.
As more companies use our AI helpers, they feed data back into the models. The models become smarter for everyone, locking in current clients and keeping rivals out.
4. Pricing Strategy
If you charge one price, you lose revenue. Some clients are willing to pay much more, while others will walk away if the price is too high (creating lost trade or deadweight loss). (Source: Pigou, 1920)
FUSE segments prices by customer size. Large corporations pay premium prices for custom setups, while smaller companies buy standardized, lower-cost packages. This captures extra willingness-to-pay (Consumer Surplus) and grows revenue.
5. Labor & Wages
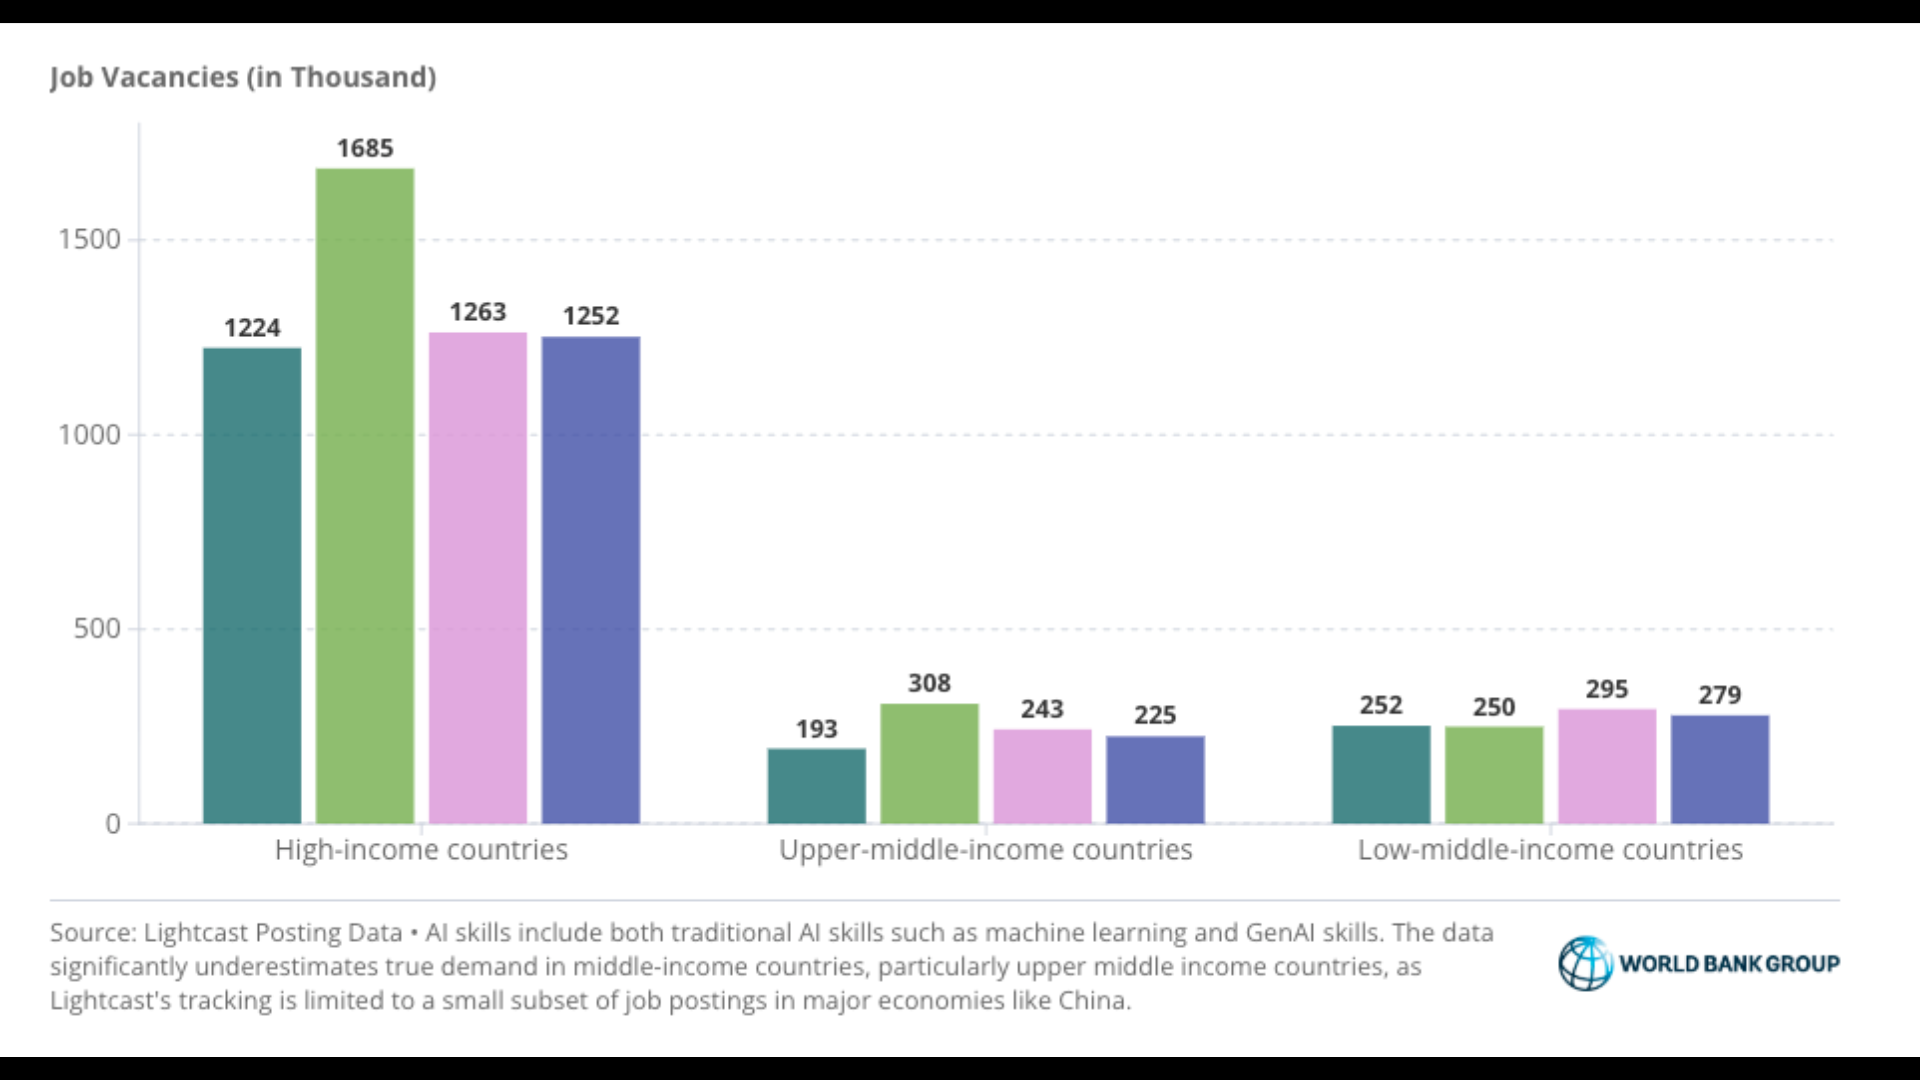
of Companies Prefer Engineers with Practical AI Skills Rather than Basic Coding
As basic coding tasks automate, worker productivity shifts. High wages go to developers who know both real industries (like sales or finance) and how to instruct AI tools. (Source: McKinsey & Company, 2025)
Stopping Brain Drain: Top developers in Nepal often face high opportunity costs—they might choose to leave Kathmandu for high-paying roles abroad. FUSE combats this by paying premium local wages and offering stock options to shift the local labor supply. (Source: Yellen, 1984)
6. Externalities & Policy
Nepal's federal policies, local hydropower, and new data sovereignty structures.
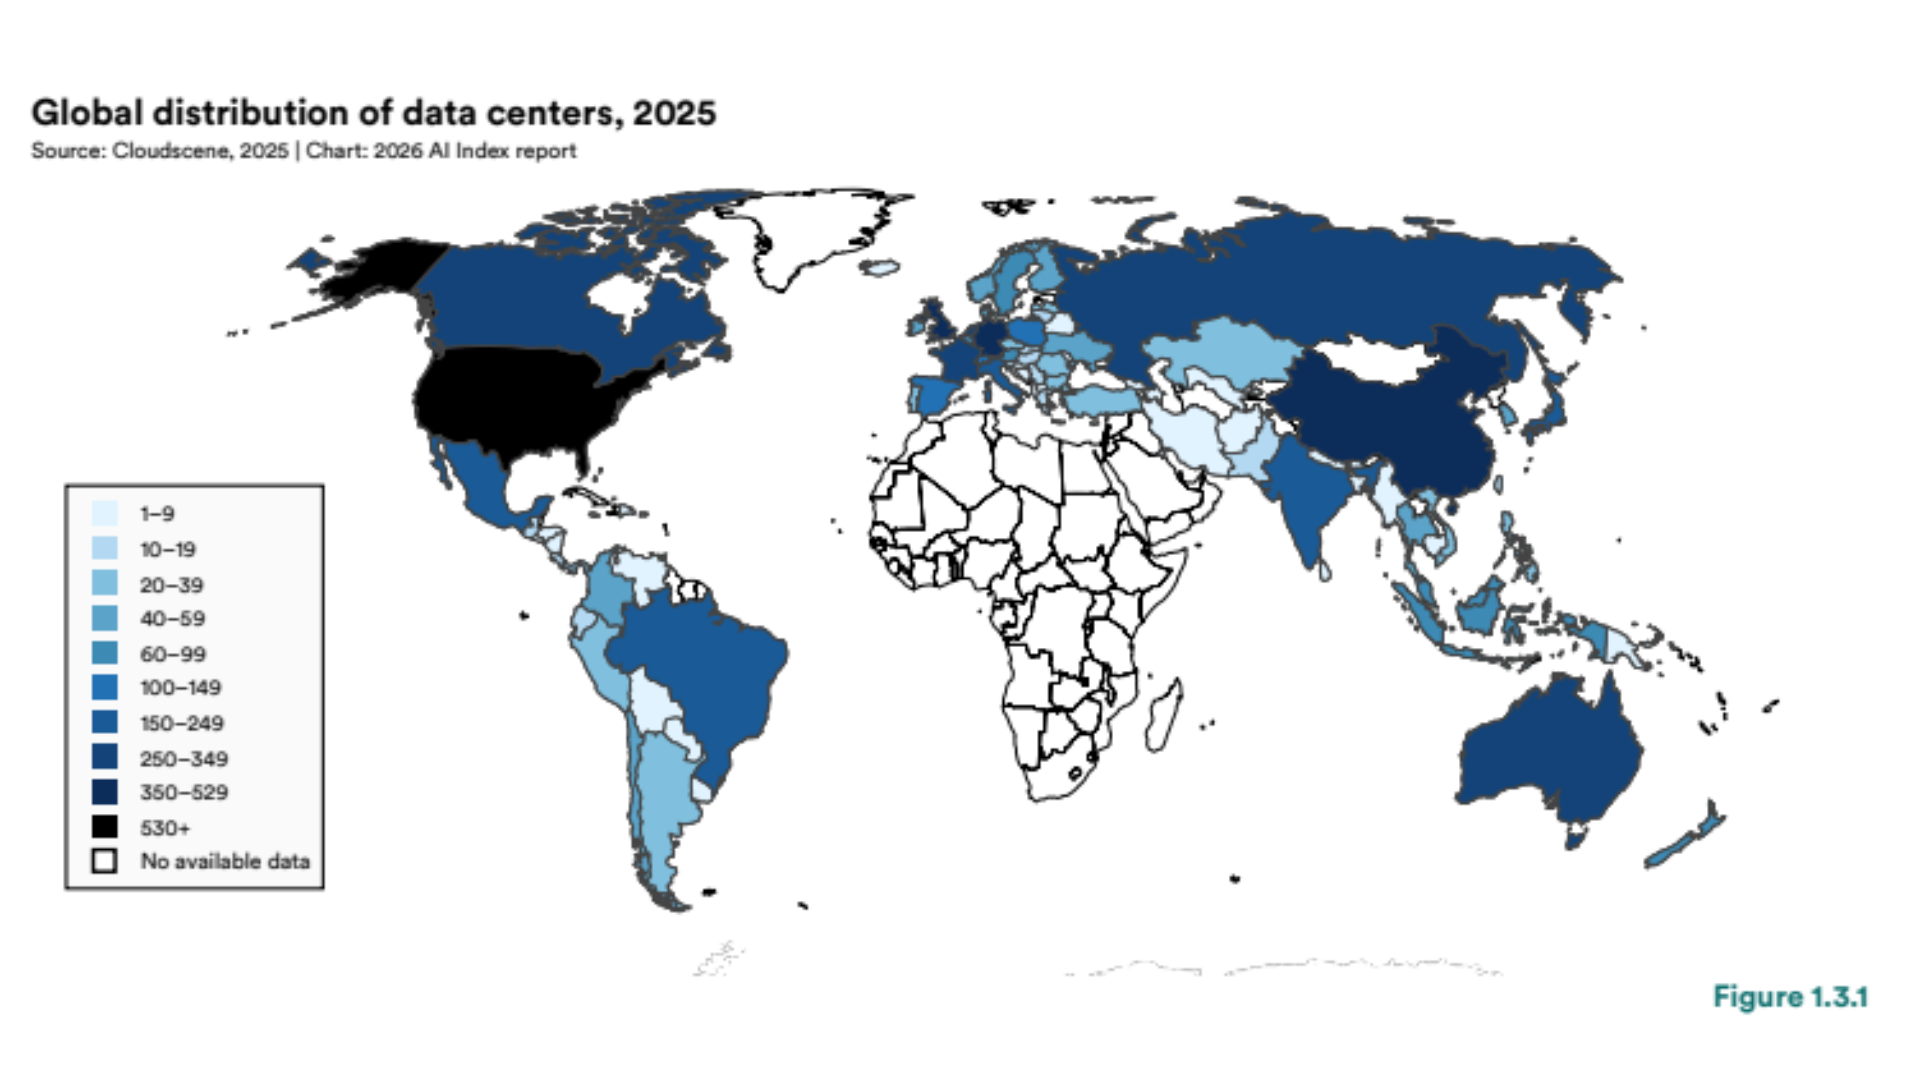
Nepal's FY 2083/84 BS budget builds a hydro-powered Sovereign AI Compute Center in Syuchatar, Kathmandu, directly lowering setup costs for local firms like FUSE (Ministry of Finance, Government of Nepal, 2026).
The budget speech funds fellowships to attract Nepalese AI researchers back home, while sovereign data rules shield local companies from foreign rivals (Government of Nepal, 2026).
7. Behavioral Economics
How human choices are influenced in business.
We layout our reporting dashboards to show important insights first. This visual architecture prevents manager burnout and nudges them to make faster choices. (Source: Thaler & Sunstein, 2008)
We anchor client expectations against multi-million dollar cloud hardware quotes. When compared to these anchors, FUSE's custom AI integrations look highly cost-effective.
For local businesses, marketing highlights sovereign pride ("Made in Nepal, for Nepal"). This acts as an emotional nudge, encouraging partners to choose domestic solutions.
8. Strategy & Financials
Comparing official audited SEC performance with pipeline values and software strategies.
| Financial Year | Audited SEC Revenue | Pipeline Contract Values | ARR Share |
|---|---|---|---|
| 2022 | $5.12M USD | $21.0M USD | 14% Share |
| 2023 | $6.85M USD | $26.0M USD | 23% Share |
| 2024 | $8.81M USD | $49.5M USD | 41% Share |
| 2025 (LTM) | $7.71M USD | $51.2M USD | 48% Share |
| 2026 (Projected) | $9.15M USD | $58.0M USD | 62% Target |
takeaways
Microeconomic action directives for corporate compliance.
Deploy predictive dashboards into reporting pipelines to isolate risk metrics and prevent choice fatigue.
Establish rigid verification loops inside models to protect operations from data compliance liabilities.
Harvest consumer surplus using real-time rate optimizations aligned with user preferences.
Perform regular data checks to preempt trans-border regulatory compliance shocks.